skyGraph:
visualizing Costa Rica’s winds
Ph.D. Franklin Hernández-Castro, Design & Implementation
Ph.D. Jorge Monge-Fallas, Data Cleaning
Ing. David Segura, Data mining
The goal of this project is the visualization of the wind speed, for one year, in Costa Rica. The characteristics that make this project unique are that the visualization is done in three dimensions, contemplating 11 isobaric layers (wind heights) and the possibility of seeing the influence of geography on wind behavior.
Besides, 12 months of data can be animated to see how wind speeds change throughout the year.
State of the Art
There are many works on visualizations of winds, however, a work that incorporates the three dimensions for such a long period and above all a country we could not find.
The most known and used visualizations are the windy web (https://www.windytv.com) or the Google Brain team (http://www.bewitched.com/windmap.html).
skyGraph:
visualización de vientos en Costa Rica
Ph.D. Franklin Hernández-Castro, Diseño e implementación
Ph.D. Jorge Monge-Fallas, Data Cleaning
Ing. David Segura, Minería de Datos
Este proyecto tenía como objetivo la visualización de la velocidad de los vientos, por un periodo de un año, en Costa Rica. Las características que hacen a este proyecto único son que la visualización se hace en tres dimensiones, contemplando 11 capas isobáricas (de alturas de los vientos) y la posibilidad de ver la influencia de la geografía en el comportamiento de los vientos.
Además de eso se pueden animar los datos de 12 meses de modo de poder ver cómo van cambiando las velocidades de vientos durante todo el año.
Estado del Arte
Hay muchos trabajos sobre visualizaciones de vientos, sin embargo, un trabajo que incorpore las tres dimensiones por un periodo tan largo de tiempo y sobre todo un país no lo pudimos encontrar.
Las visualizaciones más conocidas y usadas son la web windy (https://www.windytv.com) o la de Google Google Brain team (http://www.bewitched.com/windmap.html)

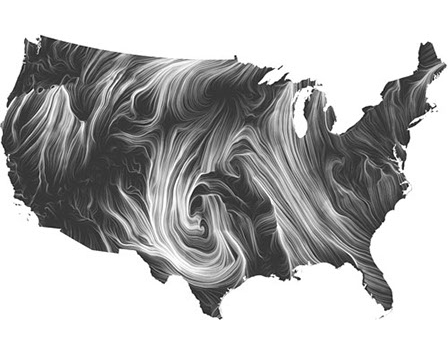
https://www.windytv.com
http://www.bewitched.com/windmap.html
Geography
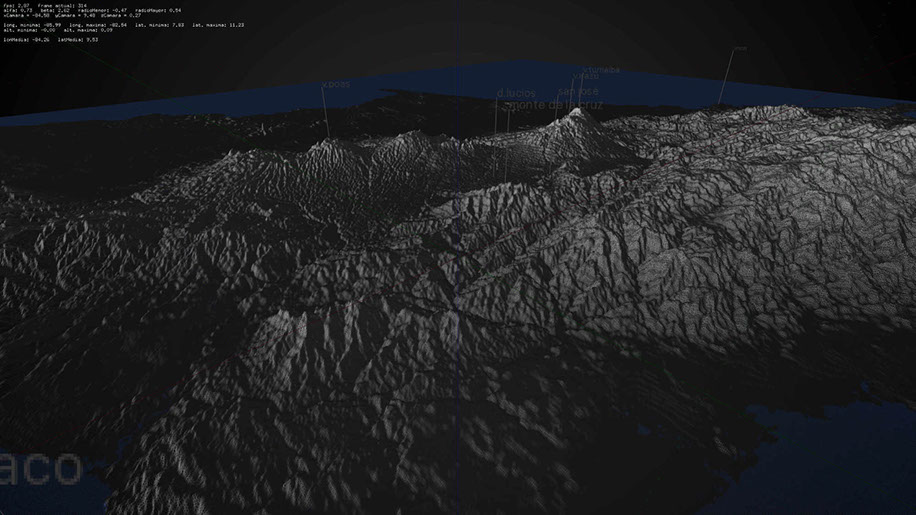
The project was mounted on the new geographical model generated by the iReal group; the data comes with the help of the PRIAS project (http://www.cenat.ac.cr/es/prias/) and NASA.
Geografía
El proyecto se montó sobre el nuevo modelo geográfico generado por el grupo iReal, que se montó con la ayuda del proyecto PRIAS (http://www.cenat.ac.cr/es/prias/) y la NASA.
Data
To choose the data set to be used in the project, data from three of the most important meteorological agencies worldwide were compared:
* NCEP/NCAR reanalysis data: Centers for Environmental Prediction (NCEP) and National Center for Atmospheric Research (NCAR)/National Oceanic and Atmospheric Administration (NOAA).
* ERA-Interim: European Centre for Medium-Range Weather Forecasts (ECMWF).
* JRA-55 reanalysis data: Japan Meteorological Agency (JMA).
The following characteristics were compared to choose the data:
(1) spatial resolution
(2) the number of pressure levels
(3) the temporary resolution
ERA-Interim data was finally used due to its high spatial resolution. Costa Rica is a small country; this feature becomes decisive.
Data was downloaded for the zonal, southern and vertical components of the wind between latitudes 5° North and 15° North and longitudes 80° West and 88° West (Figure 8). This region completely covers the terrestrial territory and part of the maritime area of Costa Rica. Using the ERA-Interim data, approximately 80 latitude data and 64 longitude data are available to create the data matrix for the territory, which is roughly equivalent to measurements every 14 km. The area covered can be seen in the figures.
Data
Para elegir el set de datos a utilizar en el proyecto se compararon los datos de tres de las más importantes agencias meteorológicas a nivel mundial:
* Datos del reanálisis NCEP/NCAR: Centers for Environmental Prediction (NCEP) y National Center for Atmospheric Research (NCAR)/National Oceanic and Atmospheric Administration (NOAA).
* Datos del reanálisis ERA-Interim: European Centre for Medium-Range Weather Forecasts (ECMWF).
* Datos del reanálisis JRA-55: Japan Meteorological Agency (JMA).
Para elegir los datos se compararon las siguientes características:
(1) la resolución espacial
(2) la cantidad de niveles de presión
(3) la resolución temporal
Finalmente se usaron los datos de ERA-Interim debido a su alta resolución espacial. Costa Rica un país muy pequeño, esta característica se convierte en decisiva.
Se descargaron los datos de las componentes zonal, meridional y vertical del viento entre las latitudes 5° Norte y 15° Norte y las longitudes 80° Oeste y 88° Oeste (Figura 8). Esta región abarca completamente el territorio terrestre y parte del territorio marítimo de Costa Rica. Al utilizar los datos de ERA-Interim se tienen aproximadamente 80 datos en latitud y 64 datos en longitud para crear la matriz de datos sobre el territorio, esto equivale aproximadamente a mediciones cada 14 km. La zona cubierta se puede apreciar en las figuras.


Design
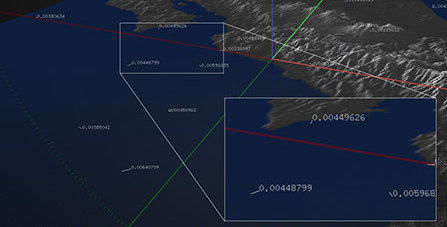
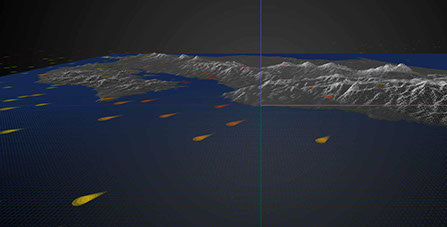
The most challenging part of the project was deciding how wind speeds would be represented. Multiple tests were made using automated boids to geographic planes showing the intensities of the components in the three dimensions. In the figures, you can see some of the possibilities explored.
Diseño
La parte más difícil del proyecto fue decidir cómo se iban a representar las velocidades de los vientos. Se hicieron múltiple pruebas utilizando desde boids automatizados hasta planos geográficos mostrando las intensidades de las componentes en las tres dimensiones. En las figuras se ven algunas de las posibilidades exploradas.

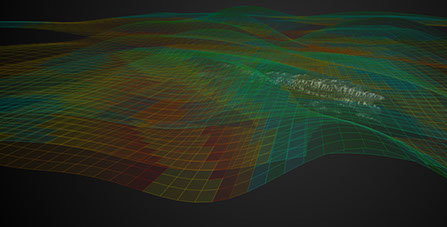
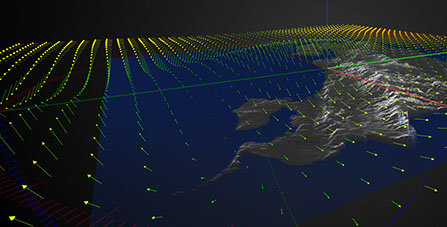
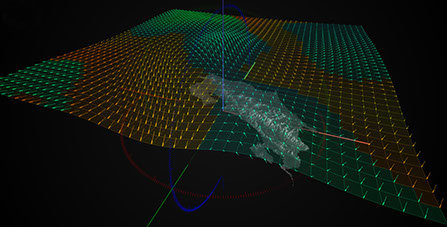
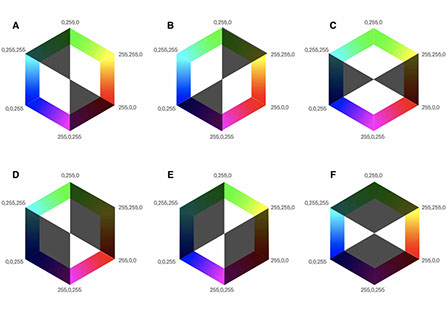
Besides, two chromatic scales were used, due to the importance of differentiating between ascending and descending winds.
In the figure to the left, you can see some of the scales tested and to the right two of them already implemented.
Además se utilizaron dos escalas cromáticas, debido a la importancia de diferenciar entre los vientos ascendentes y descendentes.
En la figura a la izquierda, se ven algunas de las escalas probadas y a la derecha dos de ellas ya implementadas.
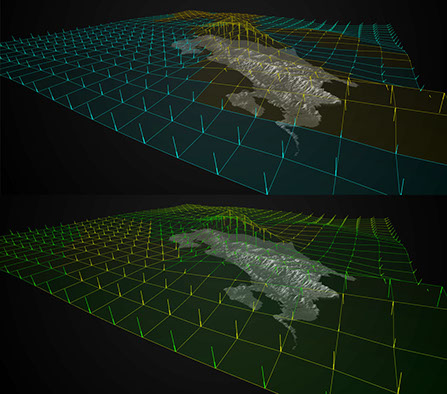
Finally, the arrows were selected instead of the boids, with the possibility to animate them, and also to combine them with the planes that show the behavior of the forces. The figure shows several pictures of one of the animations
Finalmente se seleccionaron las flechas en lugar de los boids, con la posibilidad de animarlas, y además de combinarlas con los planos que muestran el comportamiento de las fuerzas. En la figura se muestran varios cuadros de una de las animaciones.

Also, the possibility of making «data profiles» was implemented, a strategy that had been implemented in the Plinius project (over tectonic layers), which greatly helped to filter, in a useful way, the large amount of data and occlusion problems that occurred in the visualization.
Además se implementó la posibilidad de “perfiles de datos”, estrategia que se había implementado en el proyecto Plinius (sobre capas tectónicas) lo que ayudó enormemente a filtrar de modo útil la gran cantidad de datos y problemas de oclusión que se daban en la visualización.


With this in mind, we offered the possibility of dosing the data according to the needs of the user, including the possibility of changing the opacity of all elements. It is also possible to generate an animation where you can see running the twelve months of data with any configuration of filters that has been selected previously.
Con esto en mente se ofreció también la posibilidad de dosificar los datos a gusto del usuario, incluyendo la posibilidad de cambiar la opacidad de todos lo elementos. además es posible generar una animación donde se pueden ver corriendo los doce meses de datos con cualquier configuración de filtros que se haya seleccionado anteriormente.

Related publications / Publicaciones relacionadas
Hernandez-Castro, Franklin; Monge-Fallas, Jorge; López Rodríguez, Luis Daniel; Segura-Solís, David. SKYGRAPH: VISUALIZING COSTA RICA ́S WINDS. Ponte, International Journal of Sciences and Research (04.2019): 2-11 (DOI: 10.21506/j.ponte.2019.4.2)
Hernández-Castro, Franklin, and Jorge Monge-Fallas. «Visualizador 3D de la geografía de Costa Rica.» Revista Tecnología en Marcha 29.8 (2016): 77-85
Hernández-Castro, Franklin, and Jorge Monge-Fallas. «Navigation Sphere: Optimizing Virtual Sphere for Terrains Analyses» Ponte, International Journal of Sciences and Research 01.7 (2018): 25-36 (doi: 10.21506/j.ponte.2018.7.3)