mLab
mLab, is what I call all the work with my students, both at the technological institute of costa rica, at the hochschule für gestaltung schwäbisch gmünd in germany and some other schools from time to time.
at the main universities I do at least one course per semester, so you can find results twice a year.
these jobs can be done in several different fields as seen below.
mLab
mLab, es como llamo a todo el trabajo con mis estudiantes, tanto en el instituto tecnológico de costa rica, en la hochschule für gestaltung schwäbisch gmünd en alemania y algunas otras escuelas de vez en cuando.
en las universidades principales hago al menos un curso por semestre, por lo que se pueden encontrar resultados dos veces al año.
estos trabajos se pueden realizar en varias ramas diferentes como se ve a continuación.
mixed reality
in this subject we work with non-conventional interfaces, that is, we explore new technologies to interact between the computer and the human being. new devices such as kinect, arduino, leap motion, emotive, etc., are tested and explored to discover better ways to interact with virtuality.
en este tema trabajamos con interfaces no convencionales, es decir, exploramos nuevas tecnologías para interactuar entre el ordenador y el ser humano. se prueban y exploran nuevos dispositivos como kinect, arduino, leap motion, emotive, etc., para descubrir mejores formas de interactuar con la virtualidad.
mixed reality – previous projects
mixed reality – projectos anteriores
data visualization
data visualization became a permanent topic in design. at TEC costa rica we had already started more than a decade ago in the master’s degree in computer science where I have been a professor.
then we started working on data visualization at the school of design, at the request of the industry and finally from 2019 at the hochschule für gestaltung schwäbisch gmünd.
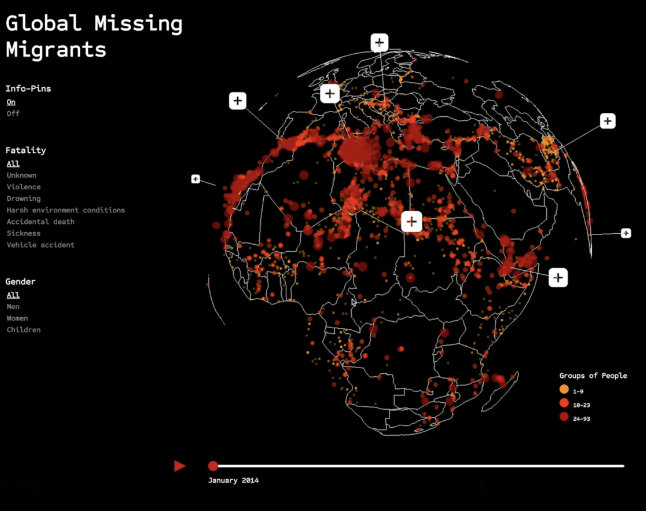
these are some of the projects developed with these students with the dashboard design cookbook methodology.
la visualización de datos se convirtió en un tema fijo en el diseño, en el TEC costa rica habíamos comenzado ya hace más una década en la maestría en ciencias de la computación donde he sido profesor.
después se comenzó a trabajar en visualización de datos en la escuela de diseño, a petición de la industria y finalmente a partir del 2019 en el hochschule für gestaltung schwäbisch gmünd.
esto son algunos de los proyectos desarrollados con esos estudiantes con la metodología del dashboard design cookbook.
app design and usability
in this topic, we design and analyze, software tools, applications, and websites.
we make different types of usability analysis (using my usability cookbook) to design our applications or to evaluating interaction in tools already in web o market.
in related topics there are a hundred of graduation projects guided by me whose summary can be seen in this link.
en este tema, diseñamos y analizamos, herramientas de software, aplicaciones y sitios web.
realizamos diferentes tipos de análisis de usabilidad (utilizando mi usability cookbook) para diseñar nuestras aplicaciones o para evaluar la interacción en herramientas ya existentes en la web o en el mercado.
en temas relacionados hay una centena de proyectos de graduación guiados por mi cuyo resumen se puede ver en este enlace.
2024
TEC 2S 2024 | non human pepper ghost
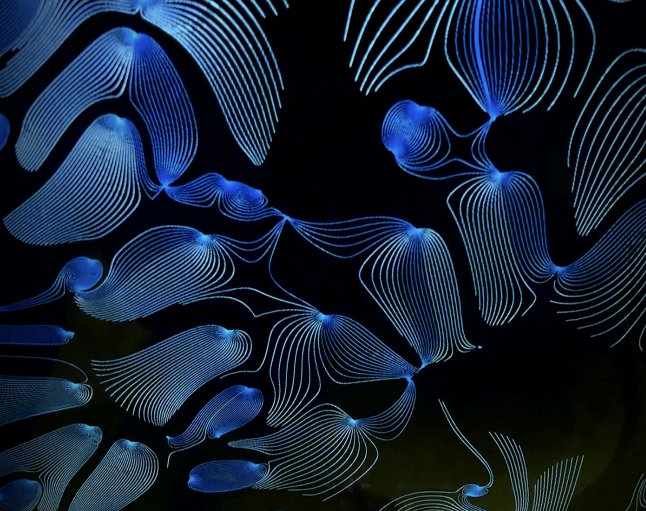
this semester at TEC the mixed reality project was about designing and implementing a simulation in the form of a machine with extraterrestrial semantics, “the non human device”.
este semestre en el TEC el proyecto de mixed reality se trató de diseñar e implementar una simulación en forma de una máquina con semántica extraterrestre, “the non human device”.
TEC 1S 2024 | virtual lotto
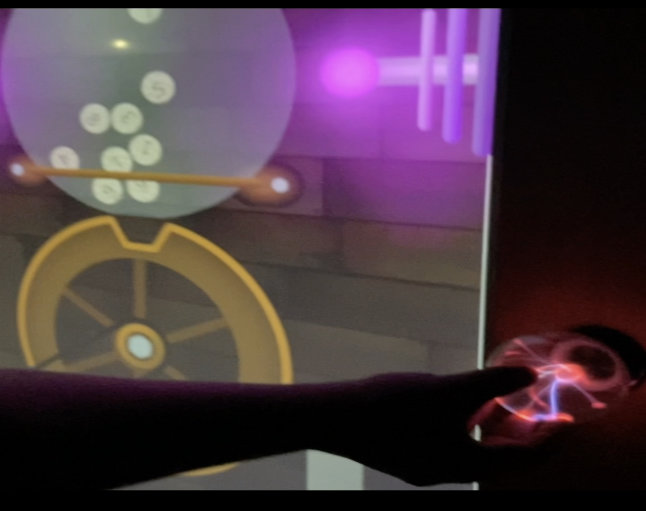
this semester the mixed reality project consisted of a “bingo” or “lottery” machine in the virtual environment, students could choose in which semantics they could do the work.
este semestre el proyecto de mixed reality consistió de una máquina de de “bingo” o “lotería” en el ambiente virtual, los estudiantes podían escoger en que semántica podían hacer el trabajo.
2023
TEC 2S 2023 | goldberg machine
this semester the mixed reality project consisted of a goldberg machine, the theme was free so students could choose. however, at least three interactions between digital and real reality were necessary.
este semestre el proyecto de mixed reality consistió de una máquina de goldberg, el tema era libre así que los estudiantes podían escoger. sin embargo, al menos tres interacciones entre la realidad digital y la real eran necesarias.
TEC 1S 2023 | touch table
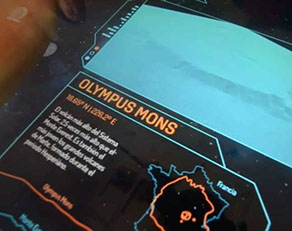
this semester the project consisted of using the interactive lab table to design an experience that included a commercial idea.
este semestre el proyecto consistió en usar la mesa interactiva del laboratorio para diseñar una experiencia que incluyera una idea comercial.
2022
TEC 2S 2022 | touch table
the project consisted of using the interactive lab table to design an experience that included a music visualization.
el proyecto consistió en usar la mesa interactiva del laboratorio para diseñar una experiencia que incluyera una visualización de música.
TEC 1S 2022 | dominos
the project was to redefine in this environment a version of the typical domino chain, all this using the box2D library.
el proyecto fue redefinir en este ambiente una versión de la típica cadena de dominos, todo esto usando la biblioteca box2D.
2021
TEC 2S 2021 | laberinto
the project was to redefine in this environment a version of a typical wooden maze in which the game is tilted to guide a ball, all this using the box2D library (https://box2d.org).
el proyecto fue redefinir en este ambiente una versión detípico laberinto de madera en el que se inclina el juego para guiar una bola, todo esto usando la biblioteca box2D (https://box2d.org).
TEC 1S 2021 | pinball
the project was to redefine in this digital environment a version of the pinball game using the box2D library (https://box2d.org).
el proyecto fue redefinir en este ambiente digital una versión del juego pinball usando la biblioteca box2D (https://box2d.org).
2020
TEC 2S 2020 | goldberg
in this case we used the idea of the «golberg machine» whose premise is «make something easy in a difficult way». with this idea and the inclusion of the box2D library (https://box2d.org) the students developed customized versions of these machines that are interacted with through the cell phone.
en este caso usamos la idea de la «máquina de golberg» cuya premisa es «hacer algo fácil de un modo difícil». con esta idea y la inclusión de la biblioteca box2D (https://box2d.org) los estudiantes desarrollaron versiones personalizadas de estas máquinas con las que se interactúa a través del teléfono celular.
TEC 1S 2020 | color tracking & voice recognition
the first semester of 2020 saw the outbreak of covid-19. that semester’s project was set aside and adapted to what could be done at each student’s home. the solution was to use «color tracking» and «voice recognition», both of which everyone could improvise at home.
el primer semestre del año 2020 se dio el brote de covid-19. el proyecto de ese semestre se dejó de lado y se adaptó a lo que se pudiera hacer en la casa de cada estudiante. la solución fue usar «color tracking» y «voice recognition», ambas cosas que todos podían improvisar en sus casas.
2019
TEC 2S-2019 | IoT & touch table
this semester 2S-2019 at the TEC we did a project trying to implement different tools in a touch table.
este semestre 2S-2019 en el TEC hicimos un proyecto tratando de implementar diferentes herramientas en una mesa táctil.
TEC 1S-2019 | IoT Smart Mirror 2030
This semester at Tecnológico de Costa Rica (1S-2019), we did a project oriented to the «Internet of Things» but with a twist, as always.
Este semestre en el Tecnológico de Costa Rica (1S-2019), hicimos un proyecto orientado al «Internet de las cosas» pero con un giro, como siempre.
HfG ss 2019 | alice mirror
This semester at Hochschule für Gestaltung Schwäbisch Gmünd in my lecture of interaction design (summer semester 2019) we made a project that we named “alice mirror”(a project inspired by the idea of a world on the other side of the mirror).
Este semestre en la Hochschule für Gestaltung Schwäbisch Gmünd en mi clase de diseño de interacción (semestre de verano 2019) hicimos un proyecto que llamamos «alice mirror»(un proyecto inspirado en la idea de un mundo al otro lado del espejo).
2025
HfG SS 2025 | data visualization
this semester we worked with the data visualization course at the hochschule für gestaltung schwäbisch gmünd in southern germany.
este semestre dicté el curso de data visualization en el hochschule für gestaltung schwäbisch gmünd en el sur de alemania.
2024
HfG WS 2024 | data visualization
this semester we worked with the data visualization course at the hochschule für gestaltung schwäbisch gmünd in southern germany.
este semestre dicté el curso de data visualization en el hochschule für gestaltung schwäbisch gmünd en el sur de alemania.
2023
HfG WS 2023 | data visualization
this semester we worked with the data visualization course at the hochschule für gestaltung schwäbisch gmünd in southern germany.
the course consists of five units of preparation and the development of a project on the topic of data visualization with the language javascript.
este semestre dicté el curso de data visualization en el hochschule für gestaltung schwäbisch gmünd en el sur de alemania.
el curso cuenta con cinco unidades de preparación y el desarrollo de un proyecto en el tema de visualización de datos con el lenguaje javascript.
HfG SS 2023 | data visualization
this semester we worked with the data visualization course at the hochschule für gestaltung schwäbisch gmünd in southern germany.
the course consists of five units of preparation and the development of a project on the topic of data visualization with the language javascript.
este semestre dicté el curso de data visualization en el hochschule für gestaltung schwäbisch gmünd en el sur de alemania.
el curso cuenta con cinco unidades de preparación y el desarrollo de un proyecto en el tema de visualización de datos con el lenguaje javascript.
2022
HfG WS 2022 | data visualization
this semester we started again with the data visualization course at the hochschule für gestaltung schwäbisch gmünd in southern germany. the course consists of five units of preparation and the development of a project on the topic of data visualization with the language javascript.
este semestre re-iniciamos con el curso de data visualization en el hochschule für gestaltung schwäbisch gmünd en el sur de alemania. el curso cuenta con cinco unidades de preparación y el desarrollo de un proyecto en el tema de visualización de datos con el lenguaje javascript.
2019
HfG WS 2019 | data visualization
this semester at HfG we decided to make one of those millstone changes we do every decade, we change from mixed-reality to data visualization.
este semestre en HfG hemos decidido hacer uno de esos cambios de rumbo que hacemos cada década, cambiamos de mixed-reality a visualización de datos.
2017
2018 lesco 3D
This semester in my data visualization course at Tecnológico de Costa Rica, I developed with Engineer Josue Porras a project to analyze the database of the LESCO sign language translator.
Este semestre en mi curso de visualización de datos en el Tecnológico de Costa Rica, desarrollé junto con el Ingeniero Josue Porras un proyecto para analizar la base de datos del traductor de señas del la lengua LESCO.
2015-2016
2016 waze visual
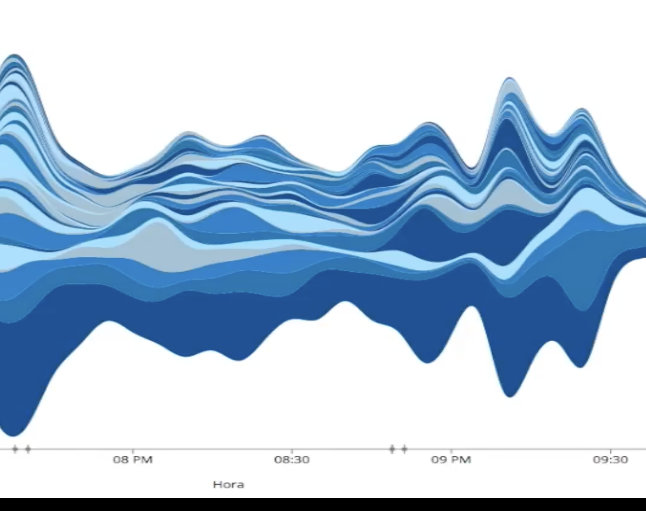
this semester we made a data visualization project with traffic data from waze application in costa rica. Evelyn Barquero Rodriguez and Sofía González Villalobos, made with me, a top 100 ranking with the worst traffic routes in costa rica. It is a interactive visualization where you can compare traffic conditions of routes, days and hours.
este semestre realizamos un proyecto de visualización de datos con los datos de tráfico de la aplicación waze en costa rica. Evelyn Barquero Rodriguez y Sofía González Villalobos, realizaron conmigo, un ranking de las 100 peores rutas de tráfico en costa rica. Es una visualización interactiva donde se pueden comparar las condiciones de tráfico de las rutas, días y horas.
2015 visualization of breast cancer factors
graduation project of nikole arguedas-elizondo mentored by me. she worked with cancer researchers from universidad de costa rica, they work on breast cancer and associated factors like sport habits, number of children and so on.
proyecto de graduación de nikole arguedas-elizondo asesorado por mi. ella trabajó con investigadores de cáncer de la universidad de costa rica, quienes trabajan en cáncer de mama y factores asociados como hábitos deportivos, número de hijos, etc.
2014
hewlett‑packard®
these works were developed in the information visualization course of the master’s degree in computer science offered by tec-costa rica for hewlett‑packard®.
estos trabajos fueron desarrollados en el curso visualización de información de la maestría en ciencias de la computación que ofrece el tec-costa rica para la empresa hewlett‑packard®.
variation viewer: genomic and proteomic data visualization
graduation project of antonio solano and verónica alfaro mentored by me.
they worked with the bioinformatics company Indromics to redesign data visualization for proteomic and genomic data. they focused them work on breast cancer related proteins because it’s one of the most deadly cancers and its research is alive and thriving.
proyecto de graduación de antonio solano y verónica alfaro asesorados por mí.
trabajaron con la empresa de bioinformática Indromics para rediseñar la visualización de datos proteómicos y genómicos. centraron su trabajo en las proteínas relacionadas con el cáncer de mama porque es uno de los cánceres más mortales y su investigación está viva y en auge
2013
intel®
these works were developed in the information visualization course of the master’s degree in computer science offered by tec-costa rica for intel.
estos trabajos fueron desarrollados en el curso visualización de información de la maestría en ciencias de la computación que ofrece el tec-costa rica para la empresa intel.
2016
2S-2016 | App design and usability | undergraduate projects
these projects are a part of 6th-semester studies in information design engineering at tec costa rica.
estos proyectos forman parte de los estudios de 6º semestre de ingeniería de diseño de la información en el tec costa rica.
1S-2016 | App design and usability | undergraduate projects
2016 1S App design and usability | graduation projects
in this topic, we design and analyze, software tools, applications, and websites.
all these projects have a real company behind and will work in market
en este tema, diseñamos y analizamos, herramientas de software, aplicaciones y sitios web.
en herramientas ya en web o mercado.
todos estos proyectos tienen una empresa real detrás y funcionarán en el mercado
interactive infographics
in this subject we design different types of infographics, students begin with a print version (A0 format) to describe a scientific concepts in a very simple way. complexity of these concepts have to be hight in order to offer a challenge to students.
later they make an interactive tool to explain the same concepts, you will find these projects per semester in links below.
en este curso diseñamos diferentes tipos de infografías; los alumnos comienzan con una versión impresa (formato A0) para describir un concepto científico de forma muy sencilla. la complejidad de estos conceptos tiene que ser alta para ofrecer un reto a los alumnos.
posteriormente realizan una herramienta interactiva para explicar los mismos conceptos, estos proyectos por semestre se encuentran en los siguientes enlaces.
2017
1S 2017 | infographic videos | undergraduate projects
these projects are a part of 4th-semester studies in information design engineering at TEC Costa Rica. we designed infographic videos of different concepts with some “time process” in it.
estos proyectos son parte de los estudios de 4º semestre de ingeniería de diseño de información en el TEC de Costa Rica. diseñamos videos infográficos de diferentes conceptos con algún «proceso de tiempo» en él.
2015
1S 2015 | cmos
the theme for this semester was CMOS. students have to explain how is made a microcrochip and fundamentals about its function.
el tema de este semestre fue el CMOS. los estudiantes tienen que explicar cómo se fabrica un microcrochip y los fundamentos de su funcionamiento.
2014
1S 2014 | animal locomotion
the theme for this semester was animal locomotion. students can choose with which animal want to work.
el tema de este semestre es la locomoción animal. los estudiantes pueden elegir con qué animal quieren trabajar.
