Caculhá
Visualization of 40 Years of Tropical Cyclone Positions and Their Rainfall Impacts in Central America
Abstract
The visualization details 40 years of data (1970-2010) of tropical storm tracks and their correlation with high rainfall reported by 88 weather stations in Central America.
The idea behind the visualization is to address the correlation of hurricane tracks with heavy rainfall inland, where no apparent relationship is seen between one and the other.
The data and the proposal were provided by researchers from the Centro de Investigaciones en Geofísica (CIGEFI) of the Universidad Costa Rica Dr. Hugo Hidalgo and Dr. Erick Alfaro and the tool developed by the iReal Research Group of the Instituto Tecnológico de Costa Rica, Ph. D. Franklin Hernández-Castro and Ph.D. Jorge Monge-Fallas.
Data
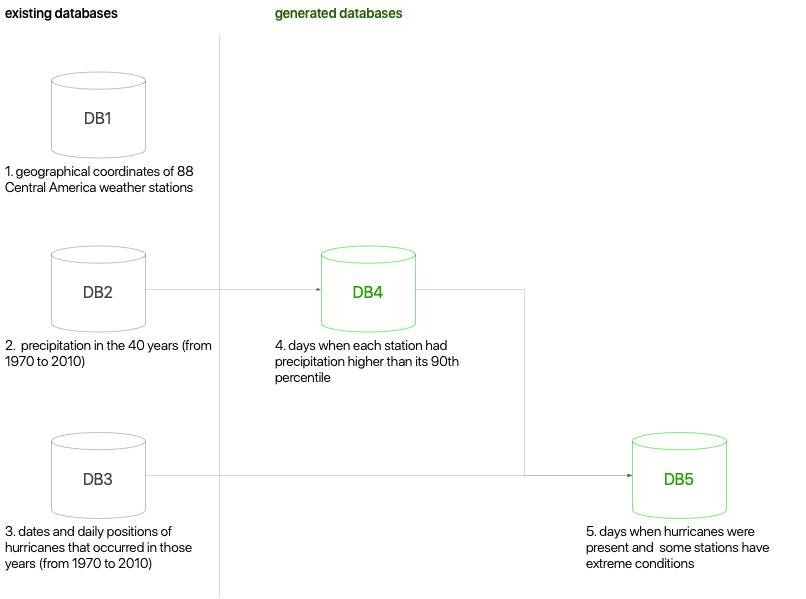
Three databases were provided:
1. A list with 88 weather stations distributed throughout Central America with their corresponding geographic coordinates (DB1).
2. All daily rainfall data from those stations in the years mentioned, about 110,000 data (DB2).
3. The dates and positions of all depressions, tropical storms, cyclones, hurricanes and typhoons (from now on only mentioned as storms for ease) that occurred in those years (DB3).
With this information, two new databases were generated:
1. A new database (DB4) with only the data where and when rainfall was greater than the 90th percentile for each station over the 40 years. This approach was taken because each region has its own climatic conditions, so rainfall that is normal at one station may represent a very rare exception at another.
2. A new database (DB5) where the positions of the storms in the days when the stations had rainfall greater than their 90th percentile are noted.
Caculhá
Visualización de 40 años de posiciones de ciclones tropicales y sus impactos climáticos en Centroamérica
Resumen
La visualización detalla se realizó con datos de 40 años (1970-2010) de la trayectoria de los tormentos tropicales y su correlación con precipitaciones altas reportadas por 88 estaciones meteorológicas en Centroamérica.
La idea detrás de la visualización es tratar de correlacionar las rutas de los huracanes con fuertes precipitaciones tierra adentro, donde no se ve relación aparente entre una y otra.
Los datos y la propuesta fueron provistos por los investigadores del Centro de Investigaciones en Geofísica (CIGEFI) de la Universidad Costa Rica Dr. Hugo Hidalgo y Dr. Erick Alfaro y la herramienta desarrollada por el grupo de investigación iReal del Instituto Tecnológico de Costa Rica, Ph. D. Franklin Hernández-Castro y Ph.D. Jorge Monge-Fallas.
Data
Se proporcionaron tres bases de datos:
1 Una lista con 88 estaciones meteorológicas distribuidas en todo Centroamérica con sus correspondientes coordenadas geográficas (DB1).
2 Todos los datos de las precipitaciones diarias de esas estaciones en los años mencionados, alrededor de 110,000 datos (DB2).
3 Las fechas y posiciones diarias de todas las depresiones, tormentas tropicales, ciclones, huracanes y tifones (de ahora en adelante solo mencionados como tormentas para facilidad) ocurridos en esos años (DB3).
Con esta información se generaron dos bases de datos nuevas:
1 Una nueva base de datos (DB4) sólo con los datos dónde las precipitaciones eran mayores al percentil 90 de cada estación en los 40 años. Se tomó este enfoque debido a que cada región tiene sus propias condiciones climáticas, por esta razón las lluvias que son normales en una estación, pueden representar una excepción muy poco frecuente en otra.
2 Una nueva base de datos (DB5) donde se anotan las posiciones de las tormentas en los d{las en que las estaciones tenían precipitaciones mayores a su 90 percentil.
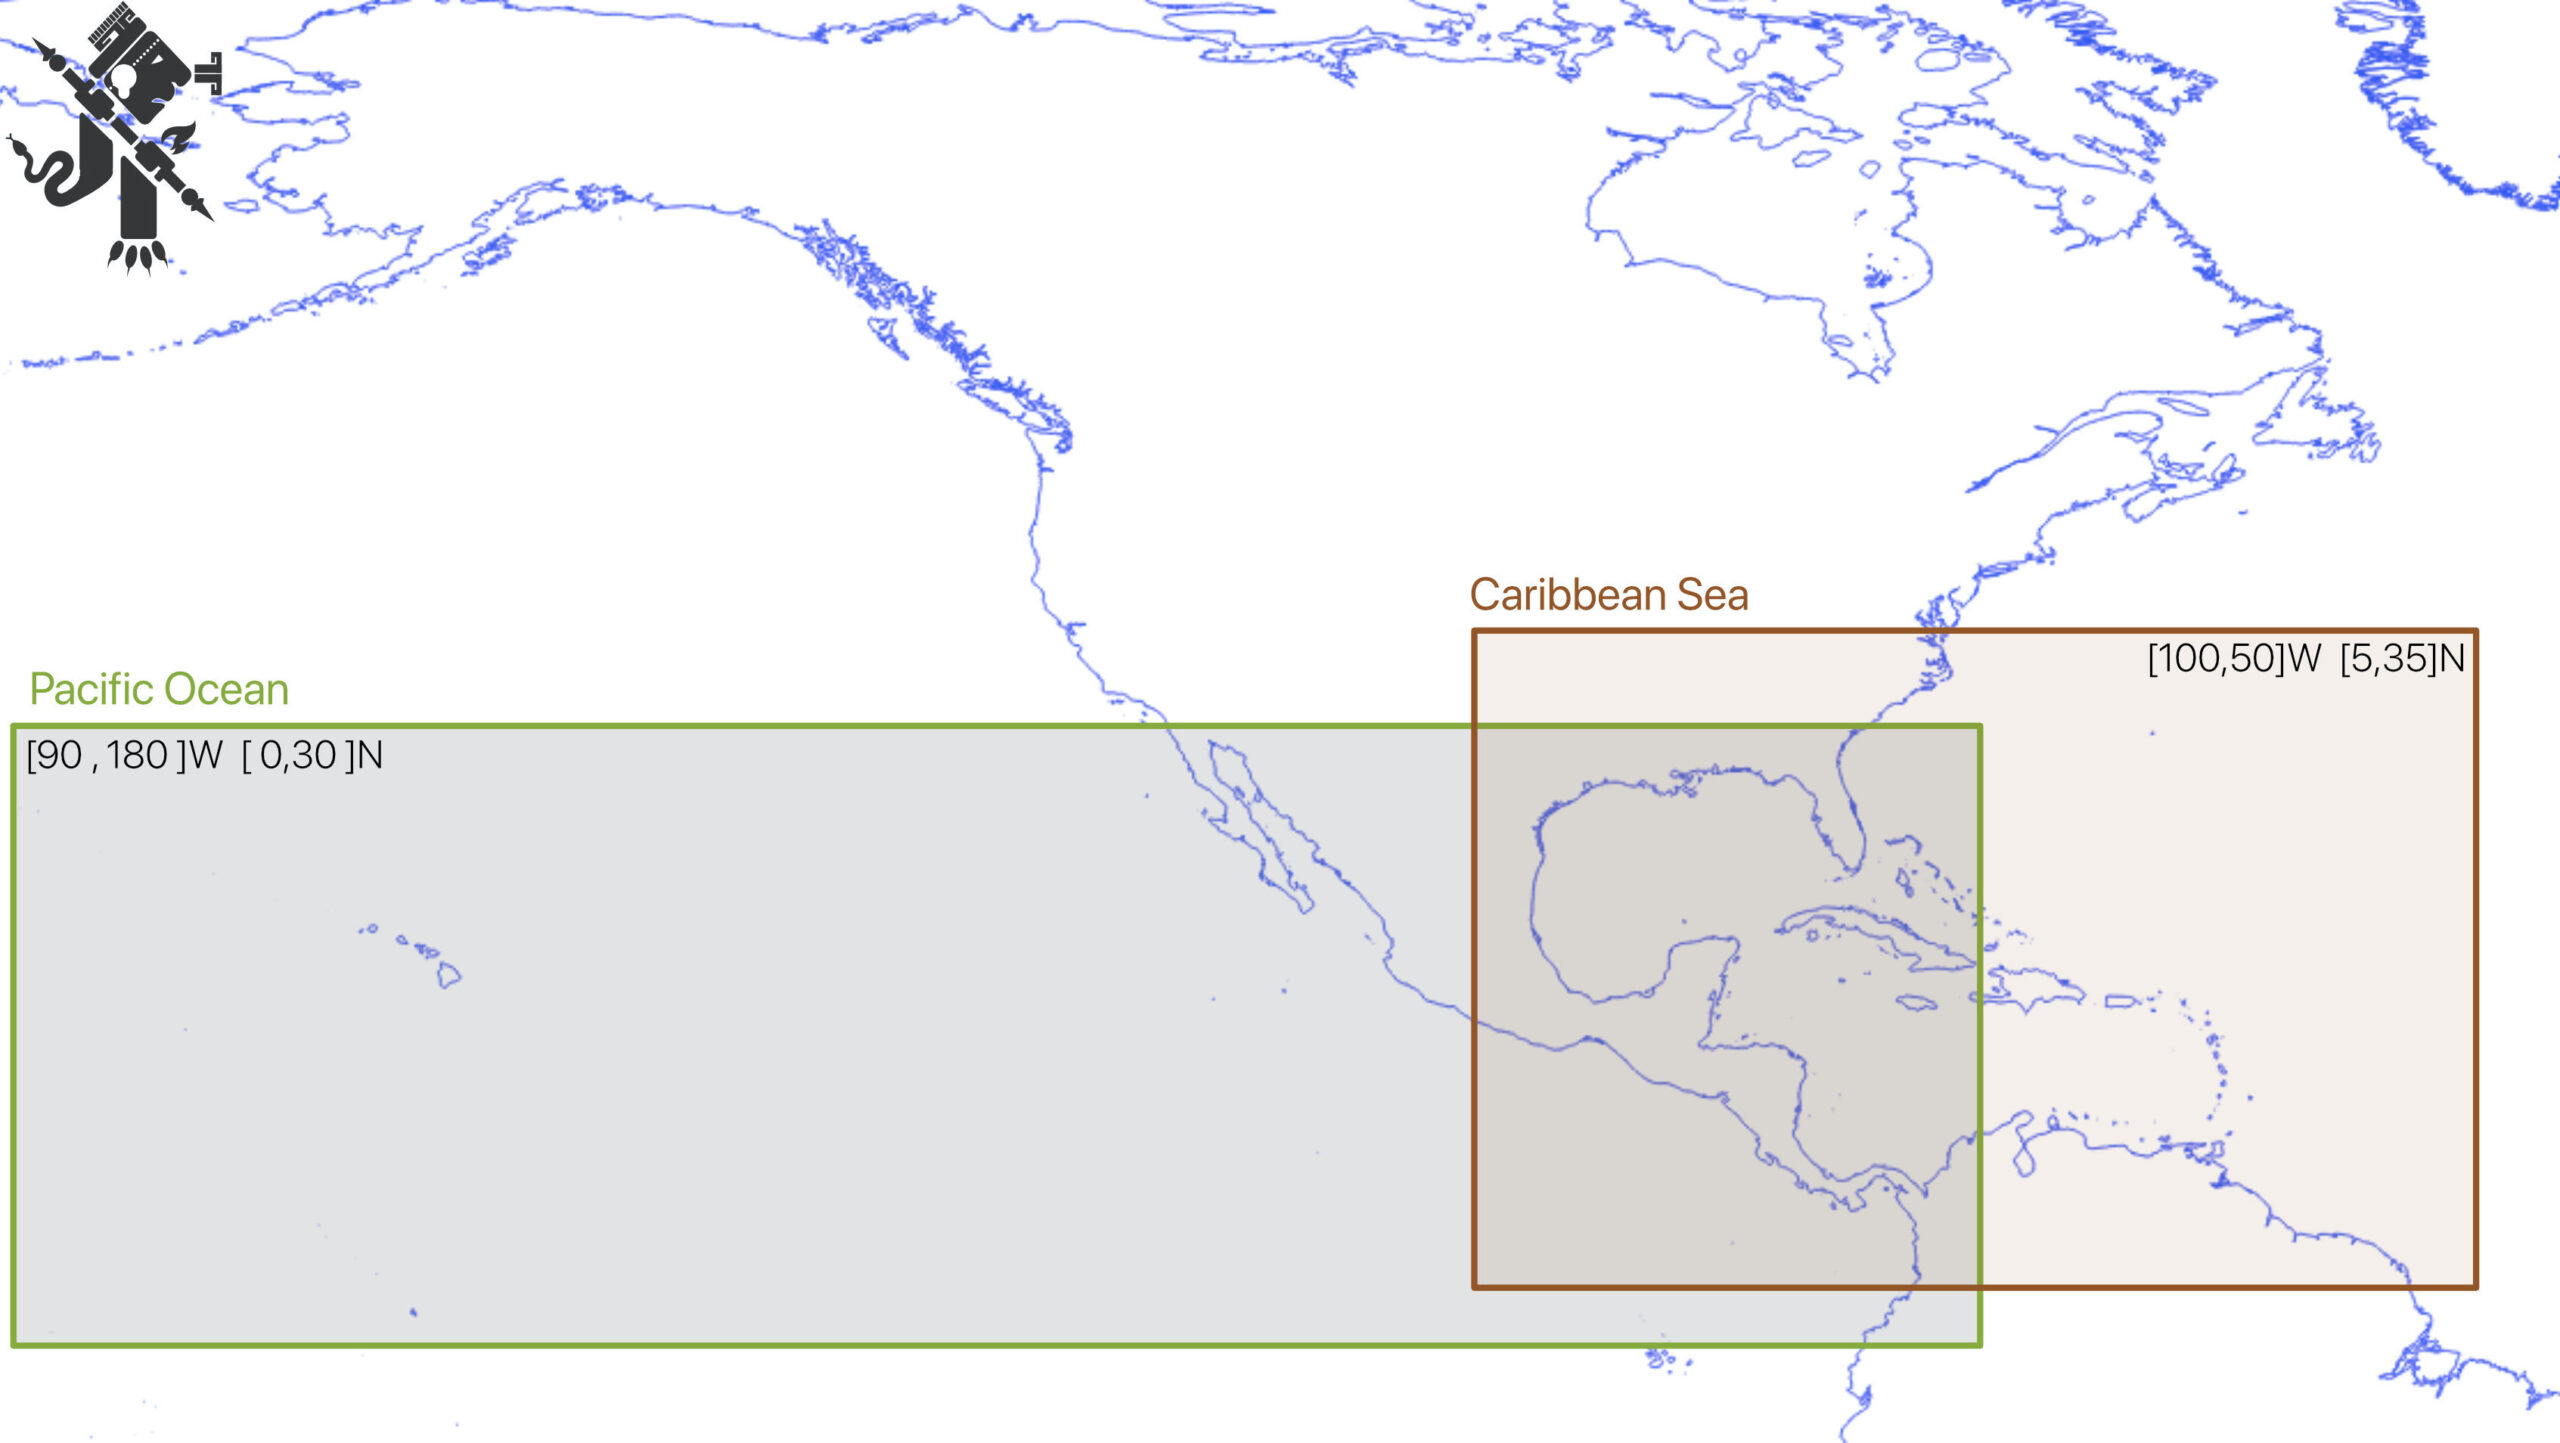
From the estimates of which areas would be of importance to the meteorologists’ scientific hypothesis, the coordinates at which each tool would work were decided. The one for the Pacific Ocean would take [90, 180]W and [0,30]N and the one for the Atlantic Ocean (Caribbean Sea) [100, 50]W and [5,35]N, the attached figure shows the
A partir de las estimaciones de cuáles zonas serían de importancia para la hipótesis científica de los meteorólogos, se decidieron las coordenadas en que se trabajaría cada herramienta. La del Océano Pacífico tomaría [90, 180]W y [0,30]N y la del Océano Atlántico (Mar Caribe) [100, 50]W y [5,35]N, la figura adjunta muestra las coordenadas.
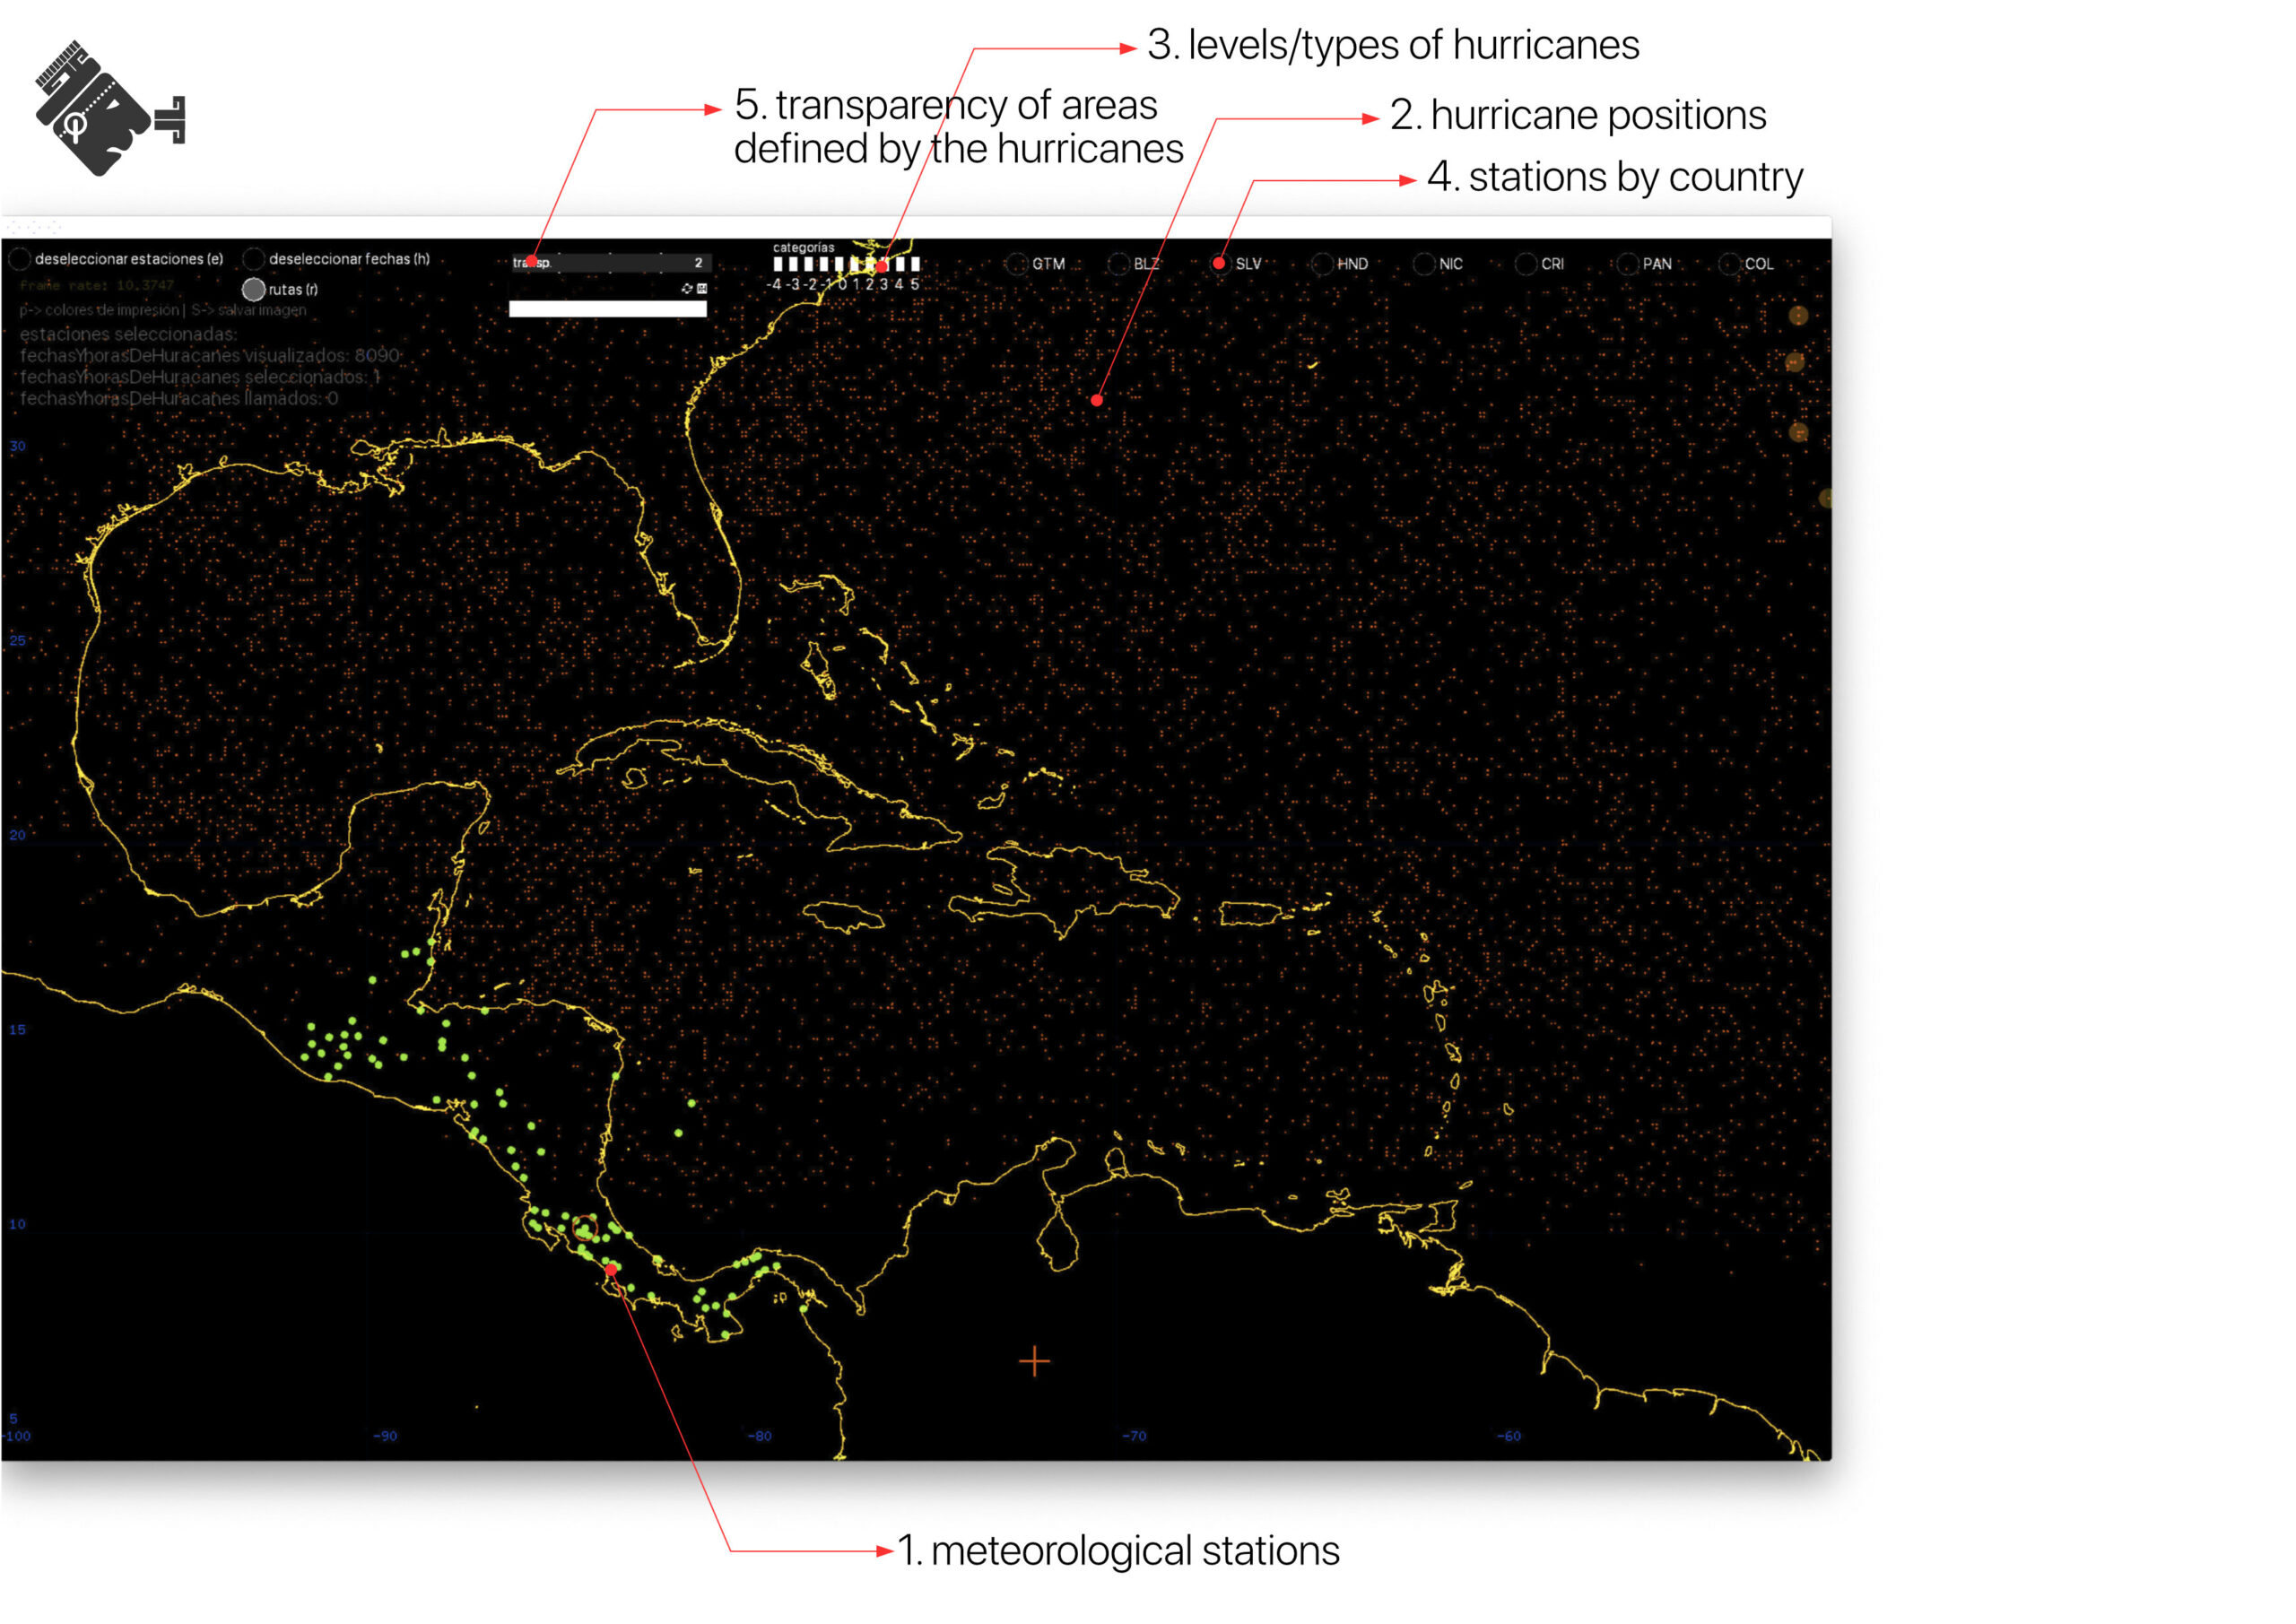
General interface
The interface shows the following elements:
• Stations: the green dots representing the position of each weather station.
• The positions of the storms per day, the red dots.
It is also possible to customize the display in several ways:
• Storm types: it is possible to filter the intensity of the hurricanes to be displayed with intensity buttons: -4, -3, -2, -1, 0, 0, 1, 2, 3, 4, 5; where from -4 to 0 are atmospheric depressions and tropical storms and from 1 are hurricane intensities (Caribbean Sea) or typhoons (Pacific Ocean).
• Stations by country: these are buttons to select all the stations of a country at the same time.
Interface general
La interface muestra los siguientes elementos:
• Estaciones: los puntos verdes que representan la posición de cada estación meteorológica.
• Las posiciones de las tormentas por día, son los puntos rojos.
Además es posible personalizar la visualización en varios modos:
• Tipos de tormentas: es posible filtrar la intensidad de los huracanes que se desean visualizar con botones de intensidad: -4, -3, -2, -1, 0, 1, 2, 3, 4, 5; donde de -4 a 0 son depresiones atmosféricas y tormentas tropicales y a partir de 1 son intensidades de huracanes (Mar Caribe) o tifones (Océano Pacífico).
• Estaciones por países: son botones para poder seleccionar todas las estaciones de un país al mismo tiempo.
When a station is selected, the points where hurricanes have been on days when that station has had rainfall greater than its 90th percentile are » highlighted».
The following picture shows a selected station in El Salvador and the typhoons, in the Pacific Ocean, associated with high rainfall in that area.
Cuando se selecciona una estación se «iluminan» los puntos donde han estado los huracanes los días en que esa estación ha tenido precipitaciones mayores de su percentil 90.
En la siguiente se muestra una estación seleccionada en El Salvador y los tifones, en el Océano Pacífico, asociados a altas precipitaciones en esa zona.

Storm visualization
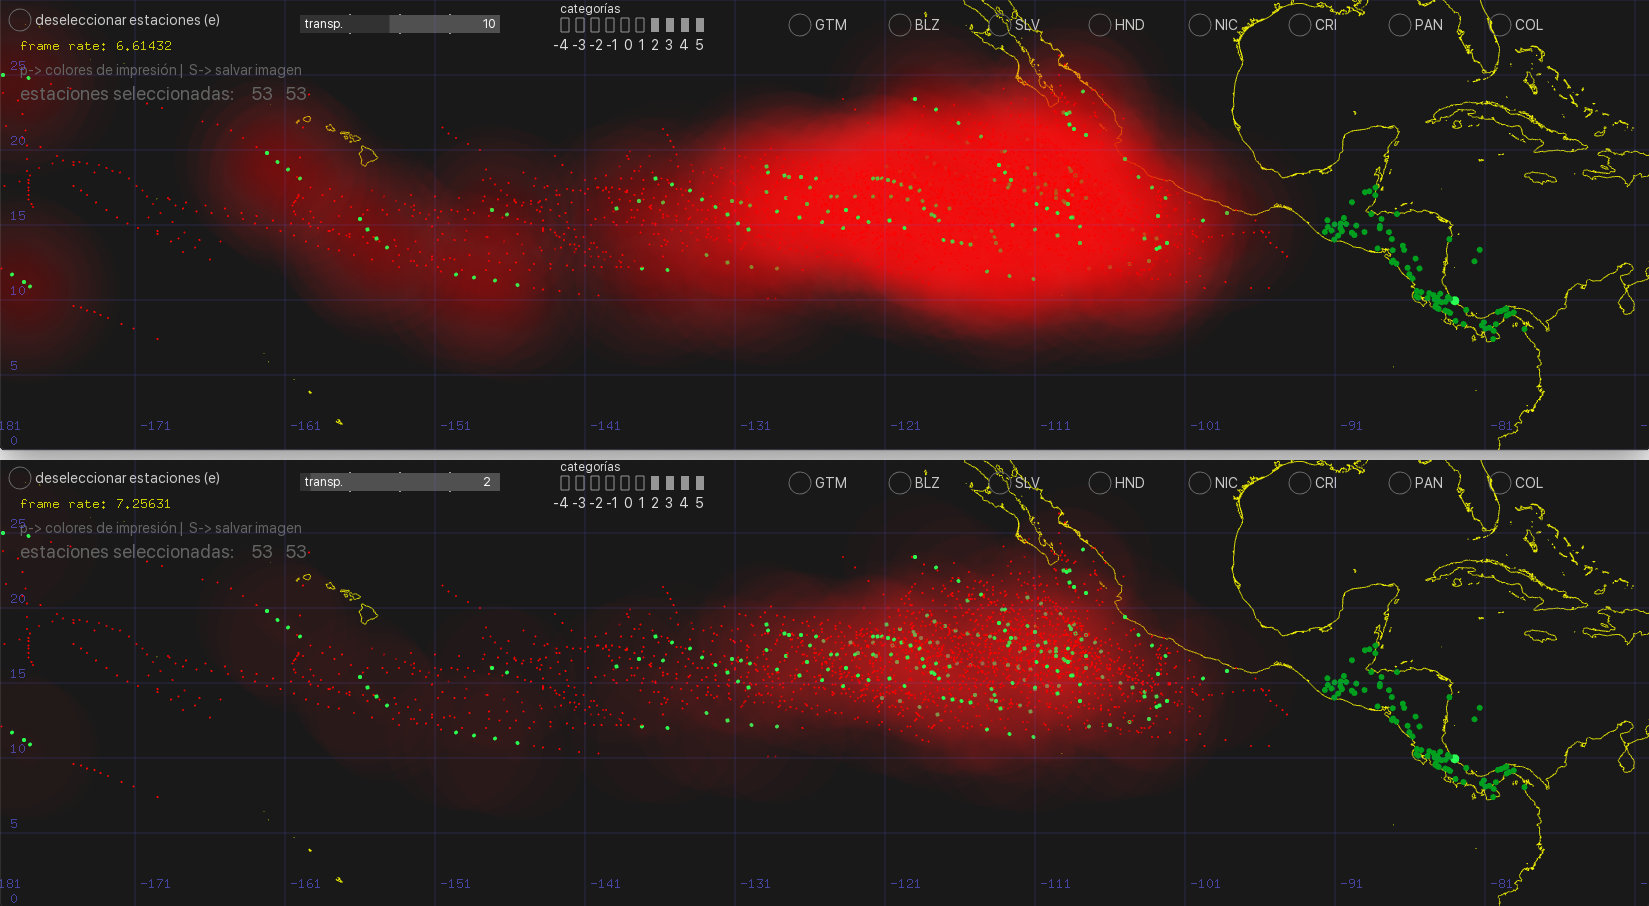
If what is wanted is to visualize an area where a sum of storms occurs over the years, each individual event is visualized with a very subtle color degradation and transparency.
Thus, when there are many storms in an area, the intensities add up and a greater concentration of color is obtained in the area. This is precisely what the scientists are looking for, as they try to find the «common» areas where several hurricanes have passed over the 40 years and which correspond to heavy rains in one or several seasons.
In this way, they identify areas in which a storm passing in the future could indicate high rainfall in the areas of the associated stations.
To better manage this effect a slider was also added to control the transparency of the storms, this allows to adjust the intensity in cases where there are few events in contrast to other cases where there are many.
In the figure we see the same selection of stations with different opacities in the red circles of the associated hurricanes.
Visualización de las tormentas
Si lo que se desea es visualizar una zona donde ocurre una sumatoria de tormentas al pasar los años, cada suceso individual se visualiza con una degradación y transparencia de color muy sutil.
Así cuando hay muchas tormentas en una zona, las intensidades se van sumando y se va obteniendo una concentración mayor de color en la zona. Esto es precisamente lo que buscan los científicos, pues tratan de encontrar las zonas «en común» donde pasaron varios huracanes en los 40 años y que corresponden a lluvias fuertes en una o varias estaciones.
De este modo, identifican zonas en las que sí una tormenta pasará en el futuro podría indicar altas precipitaciones en las zonas de las estaciones asociadas.
Para manejar mejor este efecto se agregó también un slider para controlar la transparencia de las tormentas, esto permite ajustar la intensidad en casos cuando hay pocos sucesos en contraste con otros casos donde hay muchos.
En la figura vemos la misma selección de estaciones con opacidades distintas en los círculos rojos de los huracanes asociados.
Association among objects
It is also possible to select some position of a storm (or several) and see which stations were affected when that storm was at that position.
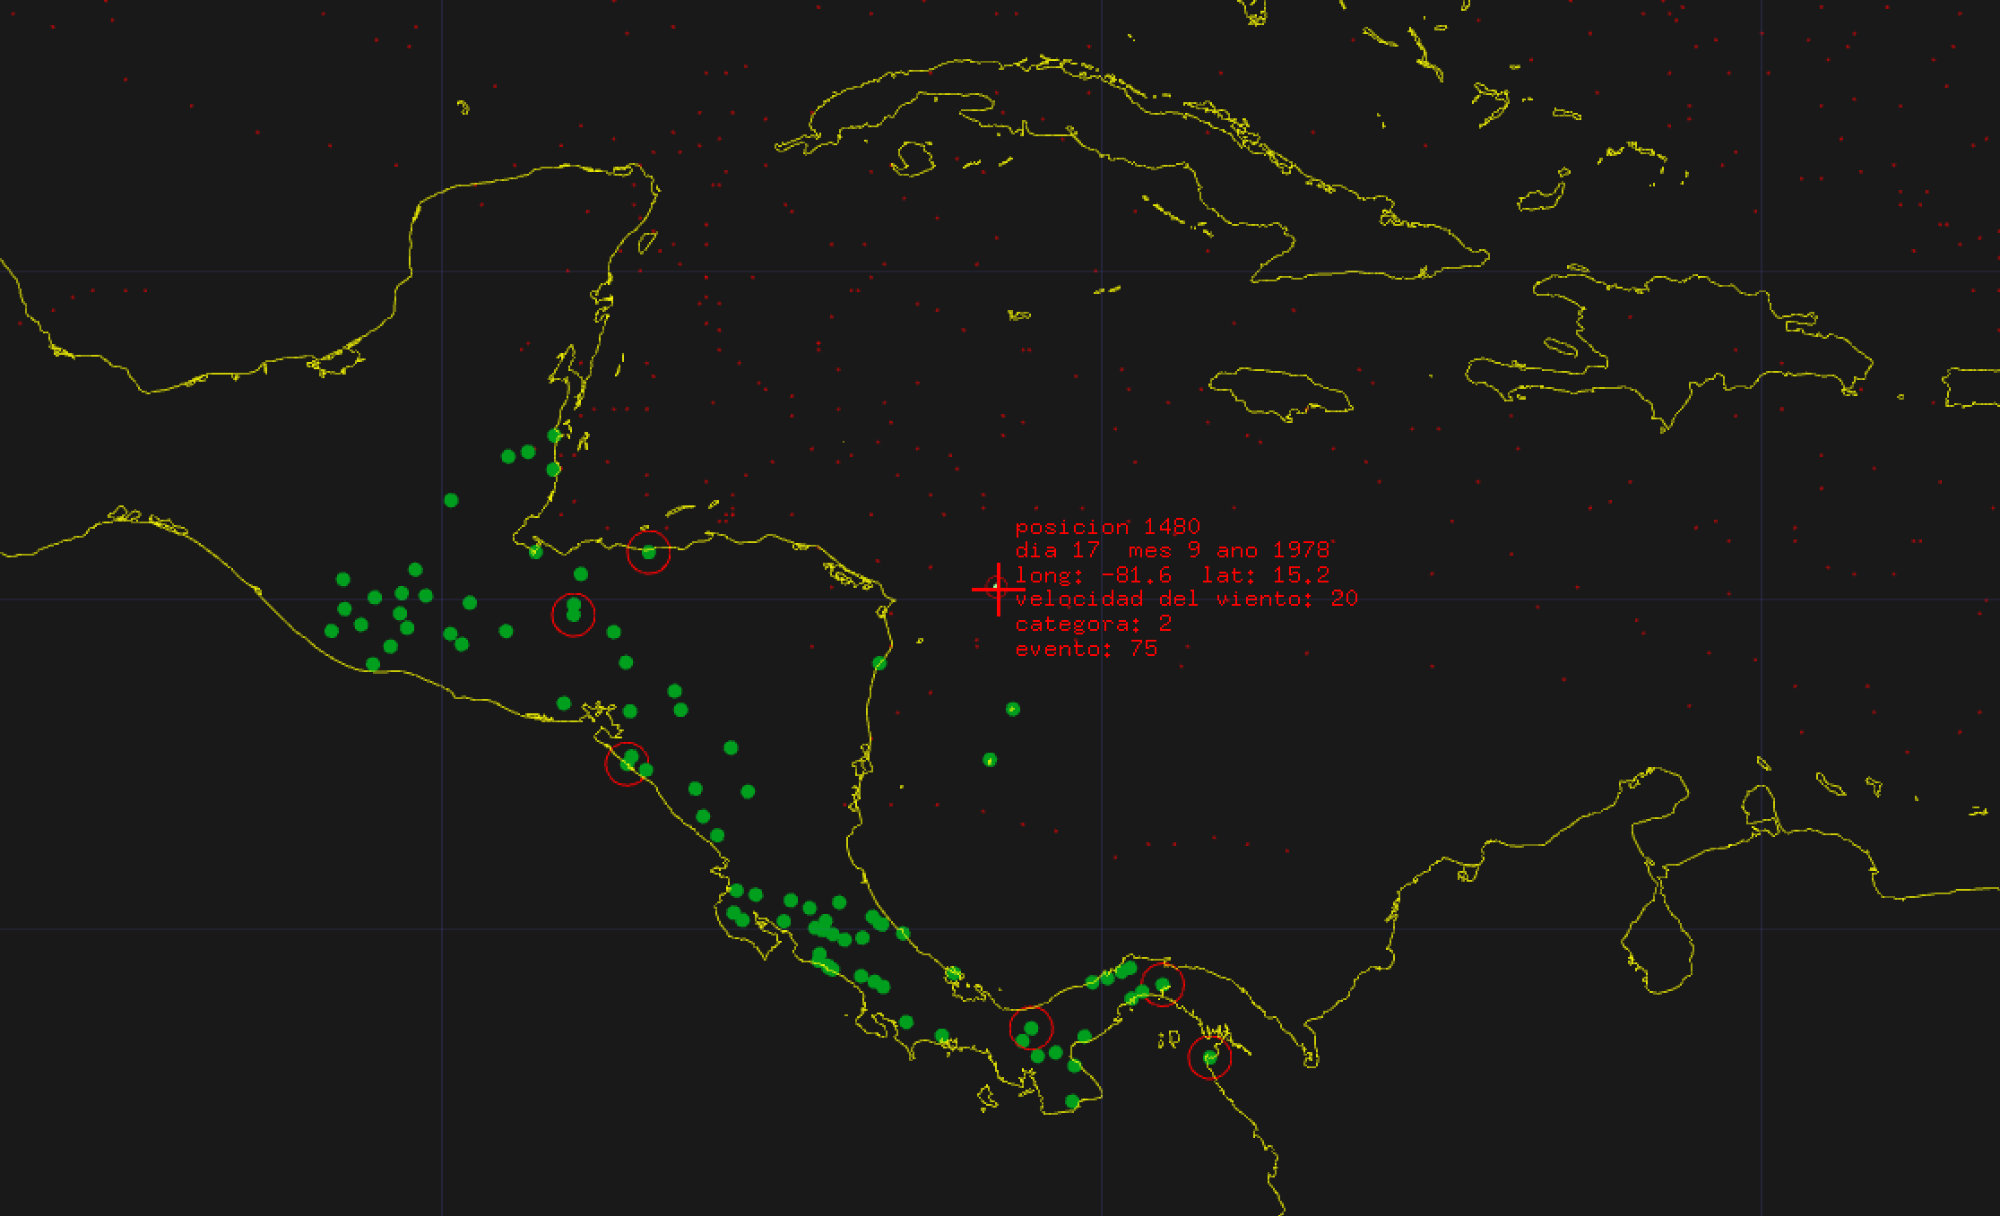
The figure shows a selected position, specifically where Hurricane 75 was on September 17, 1978, a hurricane that was at that time a category 2 and was at latitude 15.2 and longitude -81.6 as shown in the pop-up text.
As can be seen, the stations that had high rainfall on that exact day are now shown with a red circle around them. Thus, it is possible to select from the hurricanes as well as from the stations and analyze the corresponding effects.
Asociación entre objetos
También es posible seleccionar alguna posición de una tormenta (o varias) y ver cuáles estaciones se vieron afectadas cuando esa tormenta estaba en esa posición.
La figura muestra una posición seleccionada, específicamente dónde estaba el huracán 75 el 17 de septiembre de 1978, huracán que tenía en ese momento una categoría 2 y estaba en latitud de 15.2 y longitud de -81.6 como se muestra en el texto emergente.
Como se ve, las estaciones que tuvieron altas precipitaciones en ese día exacto se muestra ahora con un círculo rojo al rededor. De este modo, es posible seleccionar desde los huracanes, así como desde las estaciones y analizar los efectos correspondientes.
Event paths
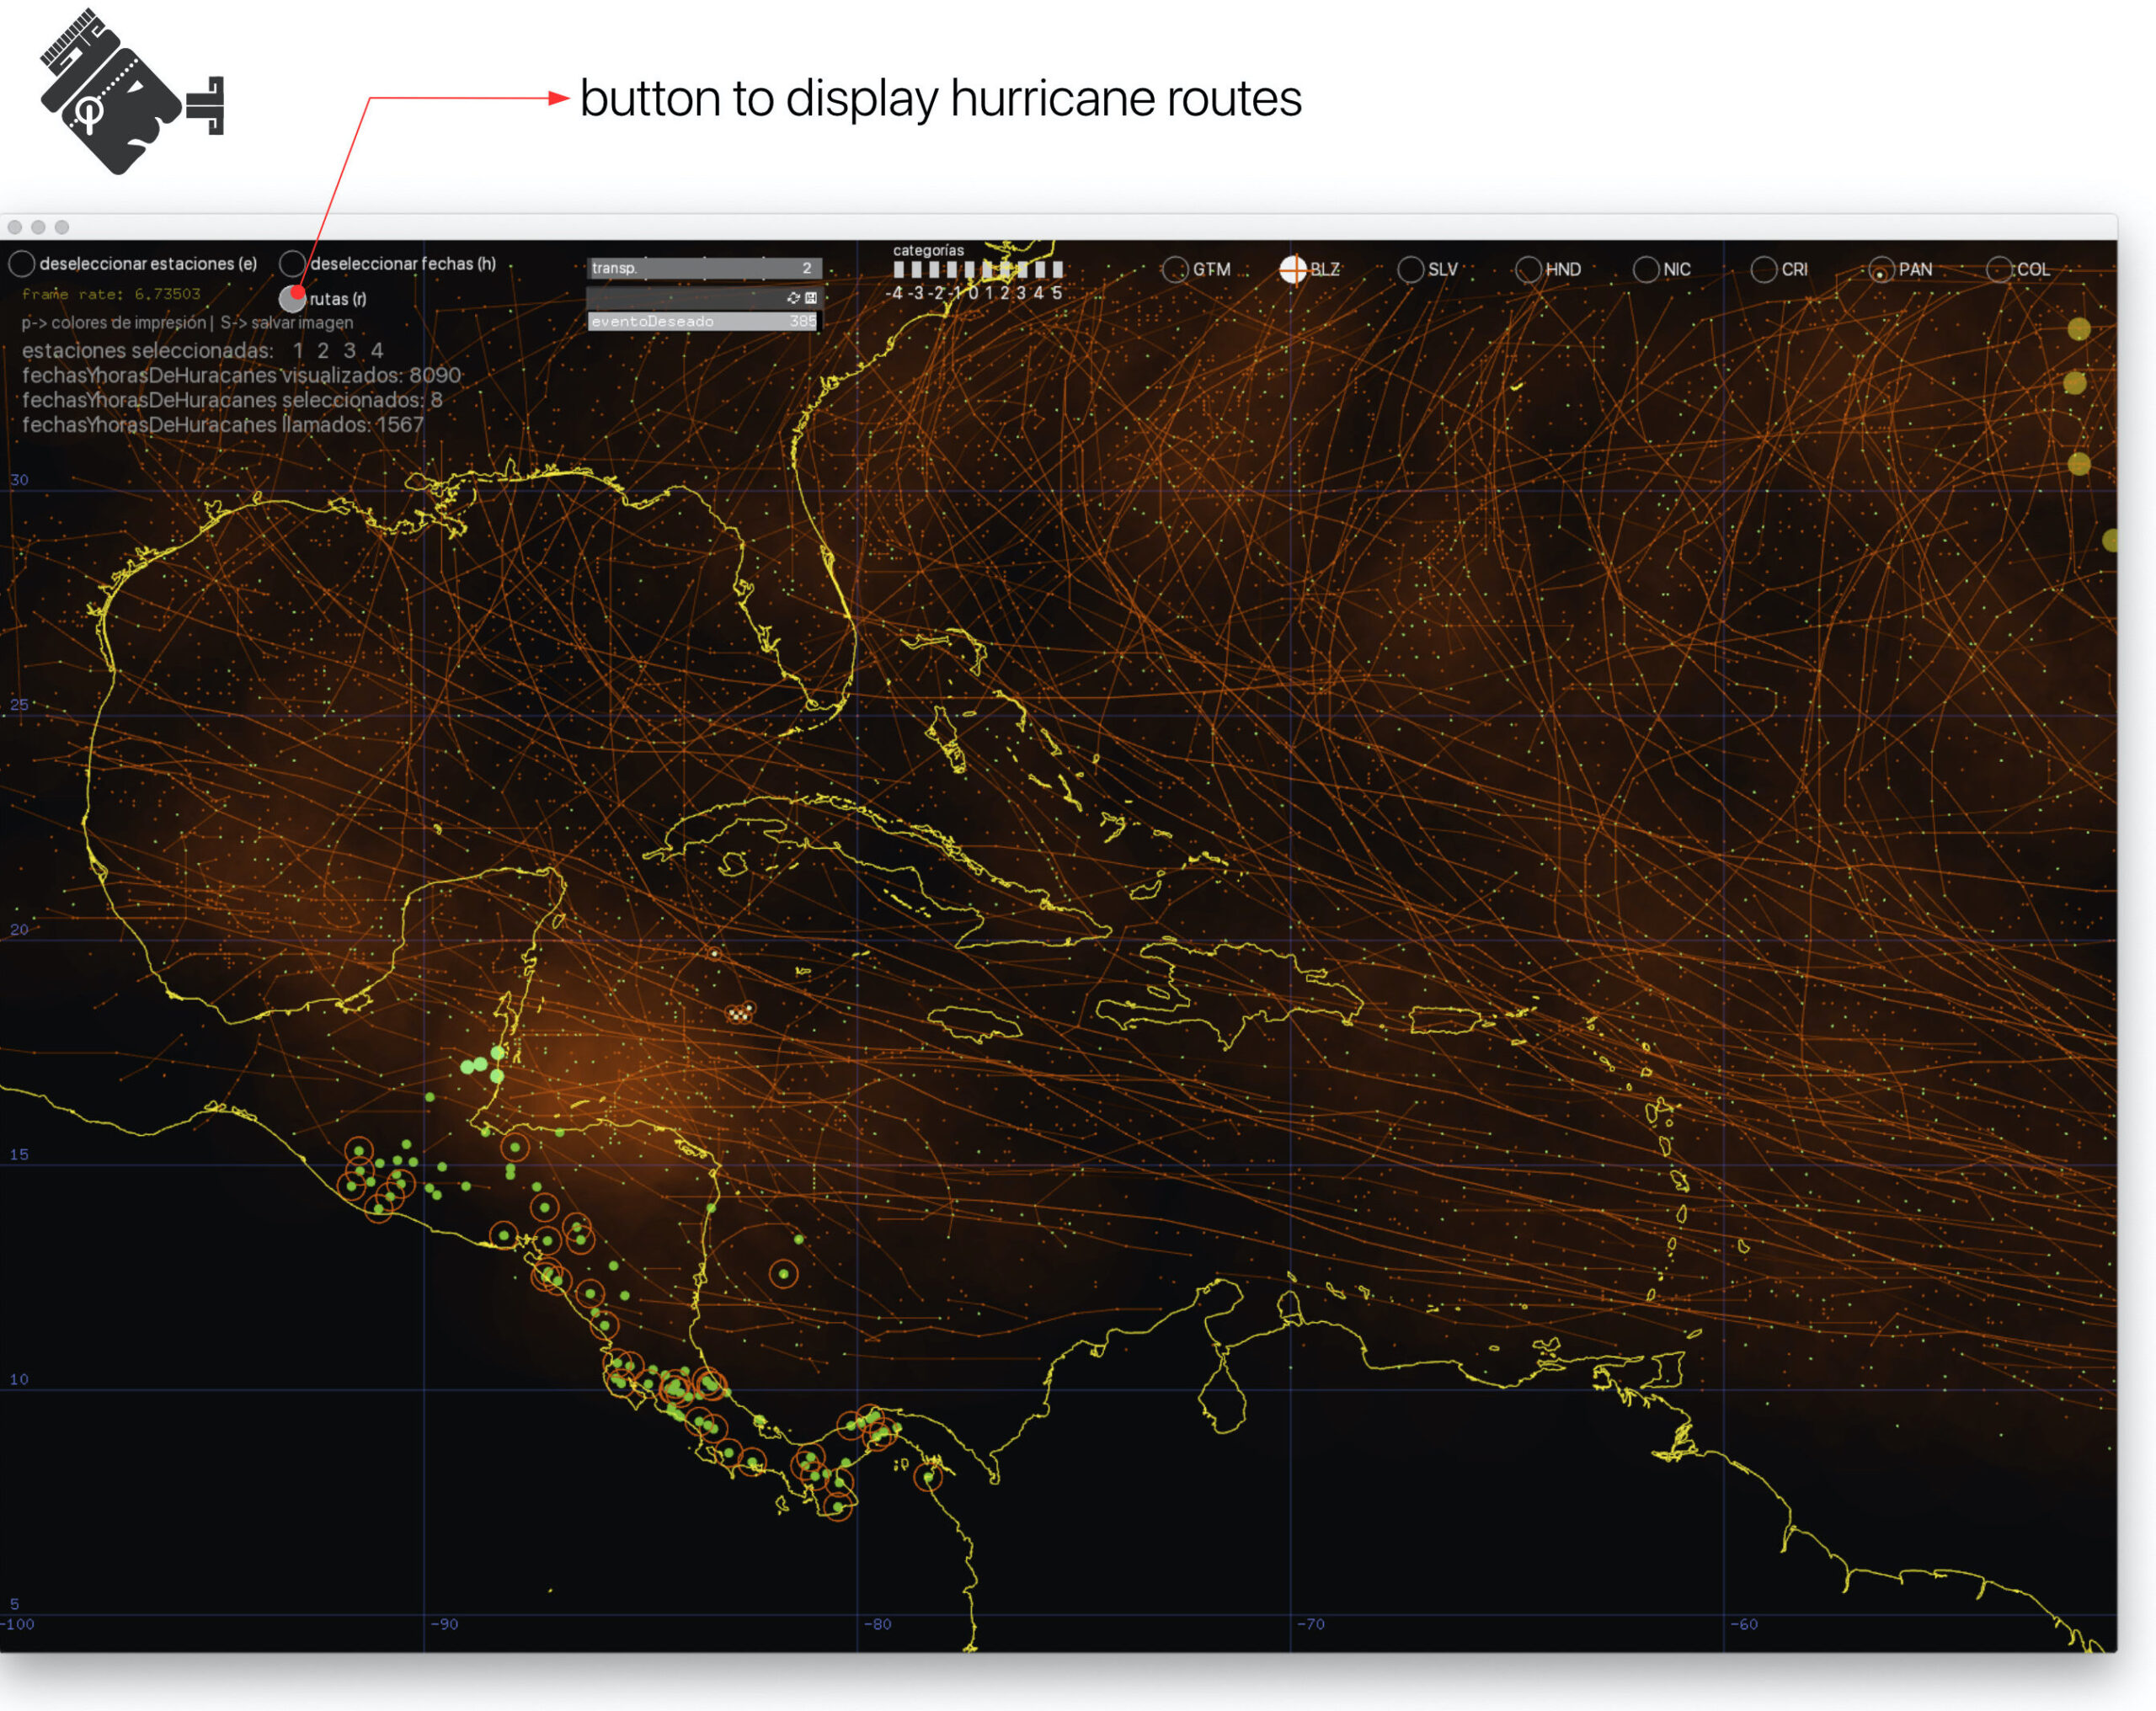
In addition to the above mentioned features, a button was implemented to visualize the paths of the different hurricanes, so that it is possible to differentiate which events (days/positions) belong to the same hurricane.
Rutas de los eventos
Además de las prestaciones comentadas se implementó un botón para poder visualizar las rutas de los diferentes huracanes, de ese modo se pueden diferenciar que eventos (días/posiciones) pertenecen al mismo huracán.
Related publications / Publicaciones relacionadas
Hernández-Castro, F., & Monge-Fallas, J., Hidalgo H.G., Alfaro, E. J.(2021). Visualization of 40 Years of Tropical Cyclone Positions and Their Rainfall Impacts in Central America. Scientific Visualization, 13(5), 78-94. http://sv-journal.org/2021-5/07/
Hidalgo, H. G., Alfaro, E. J., Hernandez-Castro, F., & Pérez-Briceño, P. M. (2020). Identification of tropical cyclones’ critical positions associated with extreme precipitation events in Central America. Atmosphere, 11(10), 1123. https://www.mdpi.com/2073-4433/11/10/1123