
Virtual Nicoya:
Motion Visualization of Nicoya Peninsula in Costa Rica
Ph.D. Franklin Hernández-Castro, Design & Implementation
Ph.D. Jorge Monge-Fallas, Data Cleaning
Ing. David Segura, Data mining
Since 2001 the Volcanological and Seismological Observatory of Costa Rica (Ovsicori) were carried out research and monitoring on the Nicoya Peninsula seismic behavior in north-west Costa Rica. For this purpose, a network of geodynamic sensors was established in this area to record deformations.
The behavior of the peninsula pointed to a significant magnitude earthquake in the coming years. The predictions were fulfilled with 7.6 ° quake of September 5, 2012, registered at 8:42 a.m. Data of GPS stations showed that the slip on the fault reached only 1.85 meters of 4 meters potential sliding on the peninsula.
The primary goal of this project was to take these data from the GPS stations of the past ten years and make a 3D animation of the peninsula activity. This project has begun in January 2015 and ended in December 2016.
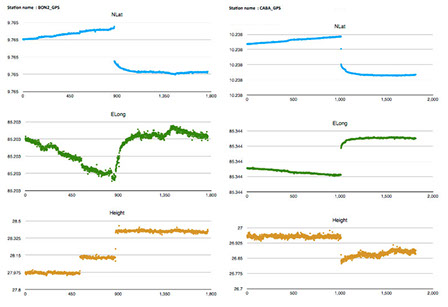
The data provided by OVSICORI, are tables of the position of the GPS stations during the previous ten years and of course, during the two minutes of the earthquake. The first task was to clean the data to identify anomalous situations; the following figure shows a station and its positions in longitude, latitude, and altitude during the days before, during and after the earthquake.
Nicoya Virtual:
Visualización del movimiento de la península de Nicoya
Ph.D. Franklin Hernández-Castro, Diseño e implementación
Ph.D. Jorge Monge-Fallas, Data Cleaning
Ing. David Segura, Minería de Datos
Desde 2001, el Observatorio Vulcanológico y Sismológico de Costa Rica (Ovsicori) llevó a cabo investigaciones y monitoreos sobre el comportamiento sísmico de la Península de Nicoya en el noroeste de Costa Rica. Para este propósito, se estableció una red de sensores geodinámicos en esta área para registrar las deformaciones.
El comportamiento de la península apuntaba a un terremoto de gran magnitud en los próximos años. Las predicciones se cumplieron con el terremoto de 7.6 ° del 5 de septiembre de 2012, registrado a las 8:42 a.m. Los datos de las estaciones de GPS mostraron que el deslizamiento en la falla solo alcanzó 1.85 metros de deslizamiento potencial de 4 metros en la península.
El objetivo principal de este proyecto fue tomar estos datos de las estaciones de GPS de los últimos diez años y hacer una animación en 3D de la actividad de la península. Este proyecto comenzó en enero de 2015 y finalizó en diciembre de 2016.
Los datos proporcionados por OVSICORI, son tablas de la posición de las estaciones de GPS durante los últimos diez años y, por supuesto, durante los dos minutos del terremoto. La primera tarea fue limpiar los datos para identificar situaciones anómalas; La siguiente figura muestra una estación y sus posiciones en longitud, latitud y altitud durante los días anteriores, durante y después del terremoto.
Distribution of the GPS stations, the size of the globes represents the amount of data accumulated in each station
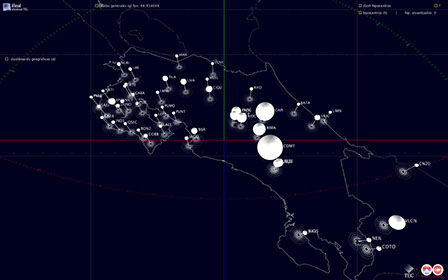
Distribución de las estaciones GPS, el tamaño de las eferas representa la cantidad de datos acumulados en cada estación
Regarding state of the art, we find an animation of the movement of the peninsula made with the same data from OVSICORI, by several universities such as Georgia Tech, the University of California, and the University of South Florida, the image shows three moments of this visualization.
Con respecto al estado del arte, encontramos una animación del desplazamiento de la península realizada con los mismos datos del OVSICORI, por varias universidades como el Georgia Tech, la Universidad de California, y la Universidad del Sur de Florida, la imagen muestra tres momentos de esta visualización.

State of the art: OVSICORI,Georgia Tech, tUniversity of California, University of South Florida (http://nicoya.eas.gatech.edu/3D_Coseismic_Displacement)
Estado del arte: OVSICORI, Georgia Tech, Universidad de California, Universidad del Sur de Florida (http://nicoya.eas.gatech.edu/3D_Coseismic_Displacement)
Design and development
To better visualize the movement of the peninsula, it was decided to divide the visualization into three different parts:
1. Visualization of flow in latitude and longitude
2. Visualization of the sinking or subduction process and soil uplift
3. 3D visualization of all movements
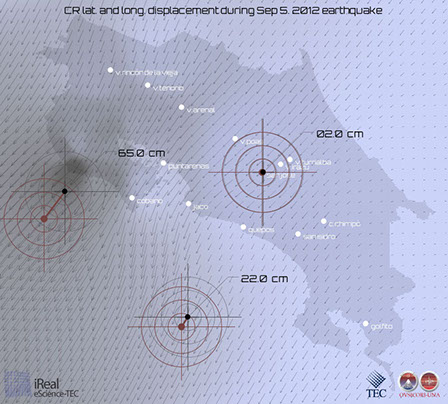
1. Visualization of movement in latitude and longitude
The first technique used in this visualization was the background color, in this case, the darker the shade of gray the stronger the offset. As a second technique, a network of arrows was deployed with the direction of the movements and with a magnitude proportional to the length of the action. Finally, we implemented a cursor that, as it moves through the different zones, shows both the direction and the relative intensity of the movement in longitude and latitude in an interactive way.
Diseño
Para pode visualizar de mejor manera el movimiento de la península, se decidió dividir la visualización en tres partes distintas:
1. Visualización del movimiento en latitud y longitud
2. Visualización del proceso de hundimiento o subducción y levantamiento
3. Visualización 3D de todos los movimientos
1. Visualización del movimiento en latitud y longitud
La primera técnica que se usó en esta visualización fue el color del fondo, en este caso entre más oscuro el tono de gris más fuerte fue el desplazamiento. Como segunda técnica se desplegó una red de flechas con la dirección de los movimientos y con una longitud proporcional a la longitud del desplazamiento. Finalmente se implementó un cursor que a medida que se mueve por la diferentes zonas va mostrando tanto la dirección como la intensidad relativa del movimiento en longitud y latitud.
2. Visualization of the sinking or subduction process and soil uplift
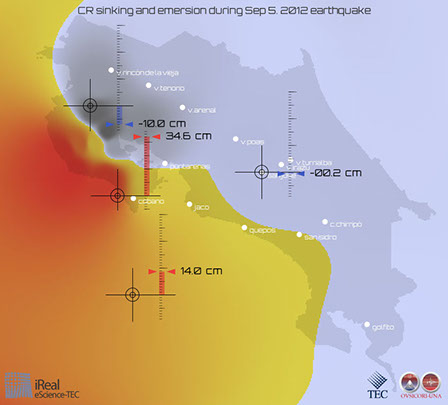
In this case, we used the same background color technique but with two color ranges, one for the parts that were lifted and one for the parts that sank. We coded the elevated areas in a yellow-red color gamut, where red is the part that was raised the most and yellow the least. In the same way, the grey range encodes the areas that have sunk the most, the darkest, and the parts that have fallen the least, the lightest. In a similar way to the previous visualization, we designed a cursor so that iteratively scientists can explore with it the parts and their subduction and lifting movements.
2. Visualización del proceso de hundimiento o subducción y levantamiento
En este caso se usó la misma técnica del color de fondo pero con dos gamas de colores, una para las partes que se levantaron y otra para las partes que se hundieron. Las partes que se levantaron se codificaron en una gama de colores amarillo-rojo, donde el rojo es la parte que más se levantó y amarillo la que menos. Del mismo modo, la gama de grises codifica las partes que más se hundieron, las más oscuras, y las que menos lo hicieron, las más claras. En forma similar a la anterior visualización diseñamos un cursor para que iterativamente se pueda ir explorando las partes y sus movimientos de subducción y levantamiento.
3. 3D visualization of all movements
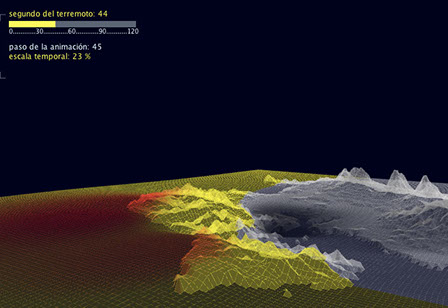
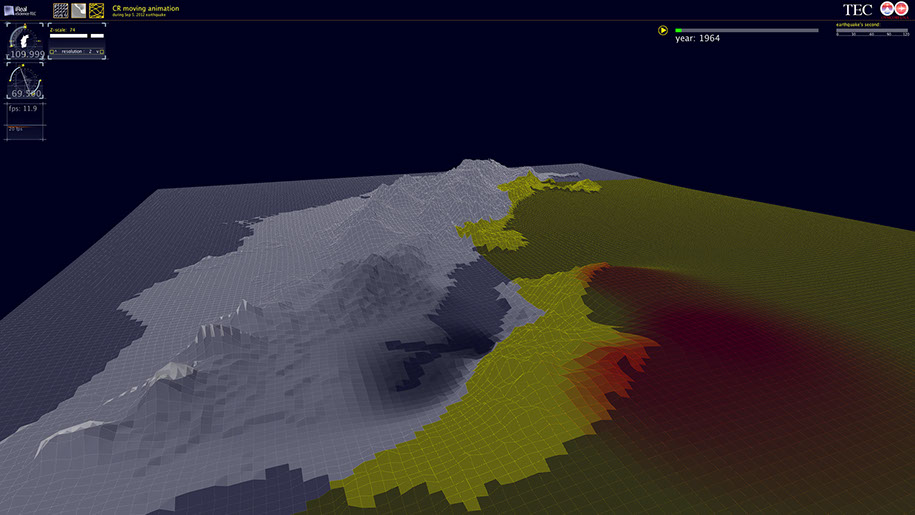
Finally, we created a visualization of the two movements mentioned above, but in three dimensions, with the possibilities of navigation in 3D space with panning and zooming.
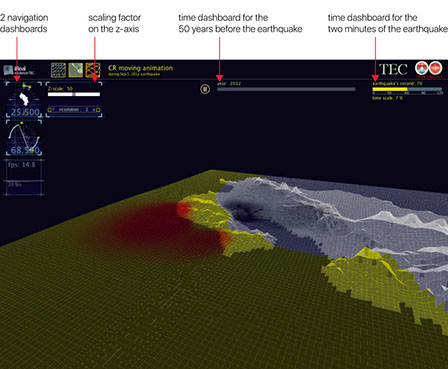
We added several dashboards to inform the user at what point in the animation he is, for example: what year of the energy storage period (the previous ten years) he is in, or what second of the earthquake. We also added two position dashboards so that the scientist knows at what angle he sees the movement. Finally, we implemented a slider so that the user can increase the magnification factor of the change in the Z axis, this to make more evident the way in which the whole peninsula moved during the earthquake.
3. Visualización 3D de todos los movimientos
Finalmente se creó una visualización de los dos movimientos antes mencionados pero en tres dimensiones, con las posibilidades de navegación en el espacio 3D con paneos y acercamientos.
Agregamos varios dashboards con el fin de informar al usuario en qué momento de la animación se encuentra, por ejemplo: en qué año del periodo de acumulación de energía (los diez años anteriores) se encuentra, o el qué segundo del terremoto. Además agregamos dos dashboard de posición de modo que el científico sepa en que ángulo está viendo el movimiento. Finalmente implementamos un slider para que el usuario puede aumentar el factor de magnificación del movimiento en el eje Z, esto con el fin de hacer más evidente el modo en que se movió toda la península durante el terremoto.
Related publications / Publicaciones relacionadas